
Equality and diversity
The gender pay gap at the OfS
Public sector bodies are required to publish data about their gender pay gap each year. The OfS has now published its gender pay gap data for 31 March 2026.
What is the gender pay gap?
The gender pay gap is the difference in the average earnings between all men and women in an organisation. It is different to equal pay, which is about the difference in actual earnings of men and women doing equal work (or work of equal value).
Since April 2017, employers with 250 or more employees have been required to publish information on their gender pay gap including:
- the mean gender pay gap
- the median gender pay gap
- the mean bonus gender pay gap
- the median bonus gender pay gap
- the proportion of men and women who received bonuses
- the proportion of men and women according to quartile pay bands.
The mean gender pay gap is the difference between the mean hourly rate of pay of male full-pay relevant employees and that of female full-pay relevant employees.
The median gender pay gap is the difference between the median hourly rate of pay of male full-pay relevant employees and that of female full-pay relevant employees.
OfS workforce
The OfS had a workforce of 563 on 31 March 2026. Due to the size of our organisation, small changes in our staffing can have a large impact on the gender pay gap we report.
Our gender pay gaps – key points
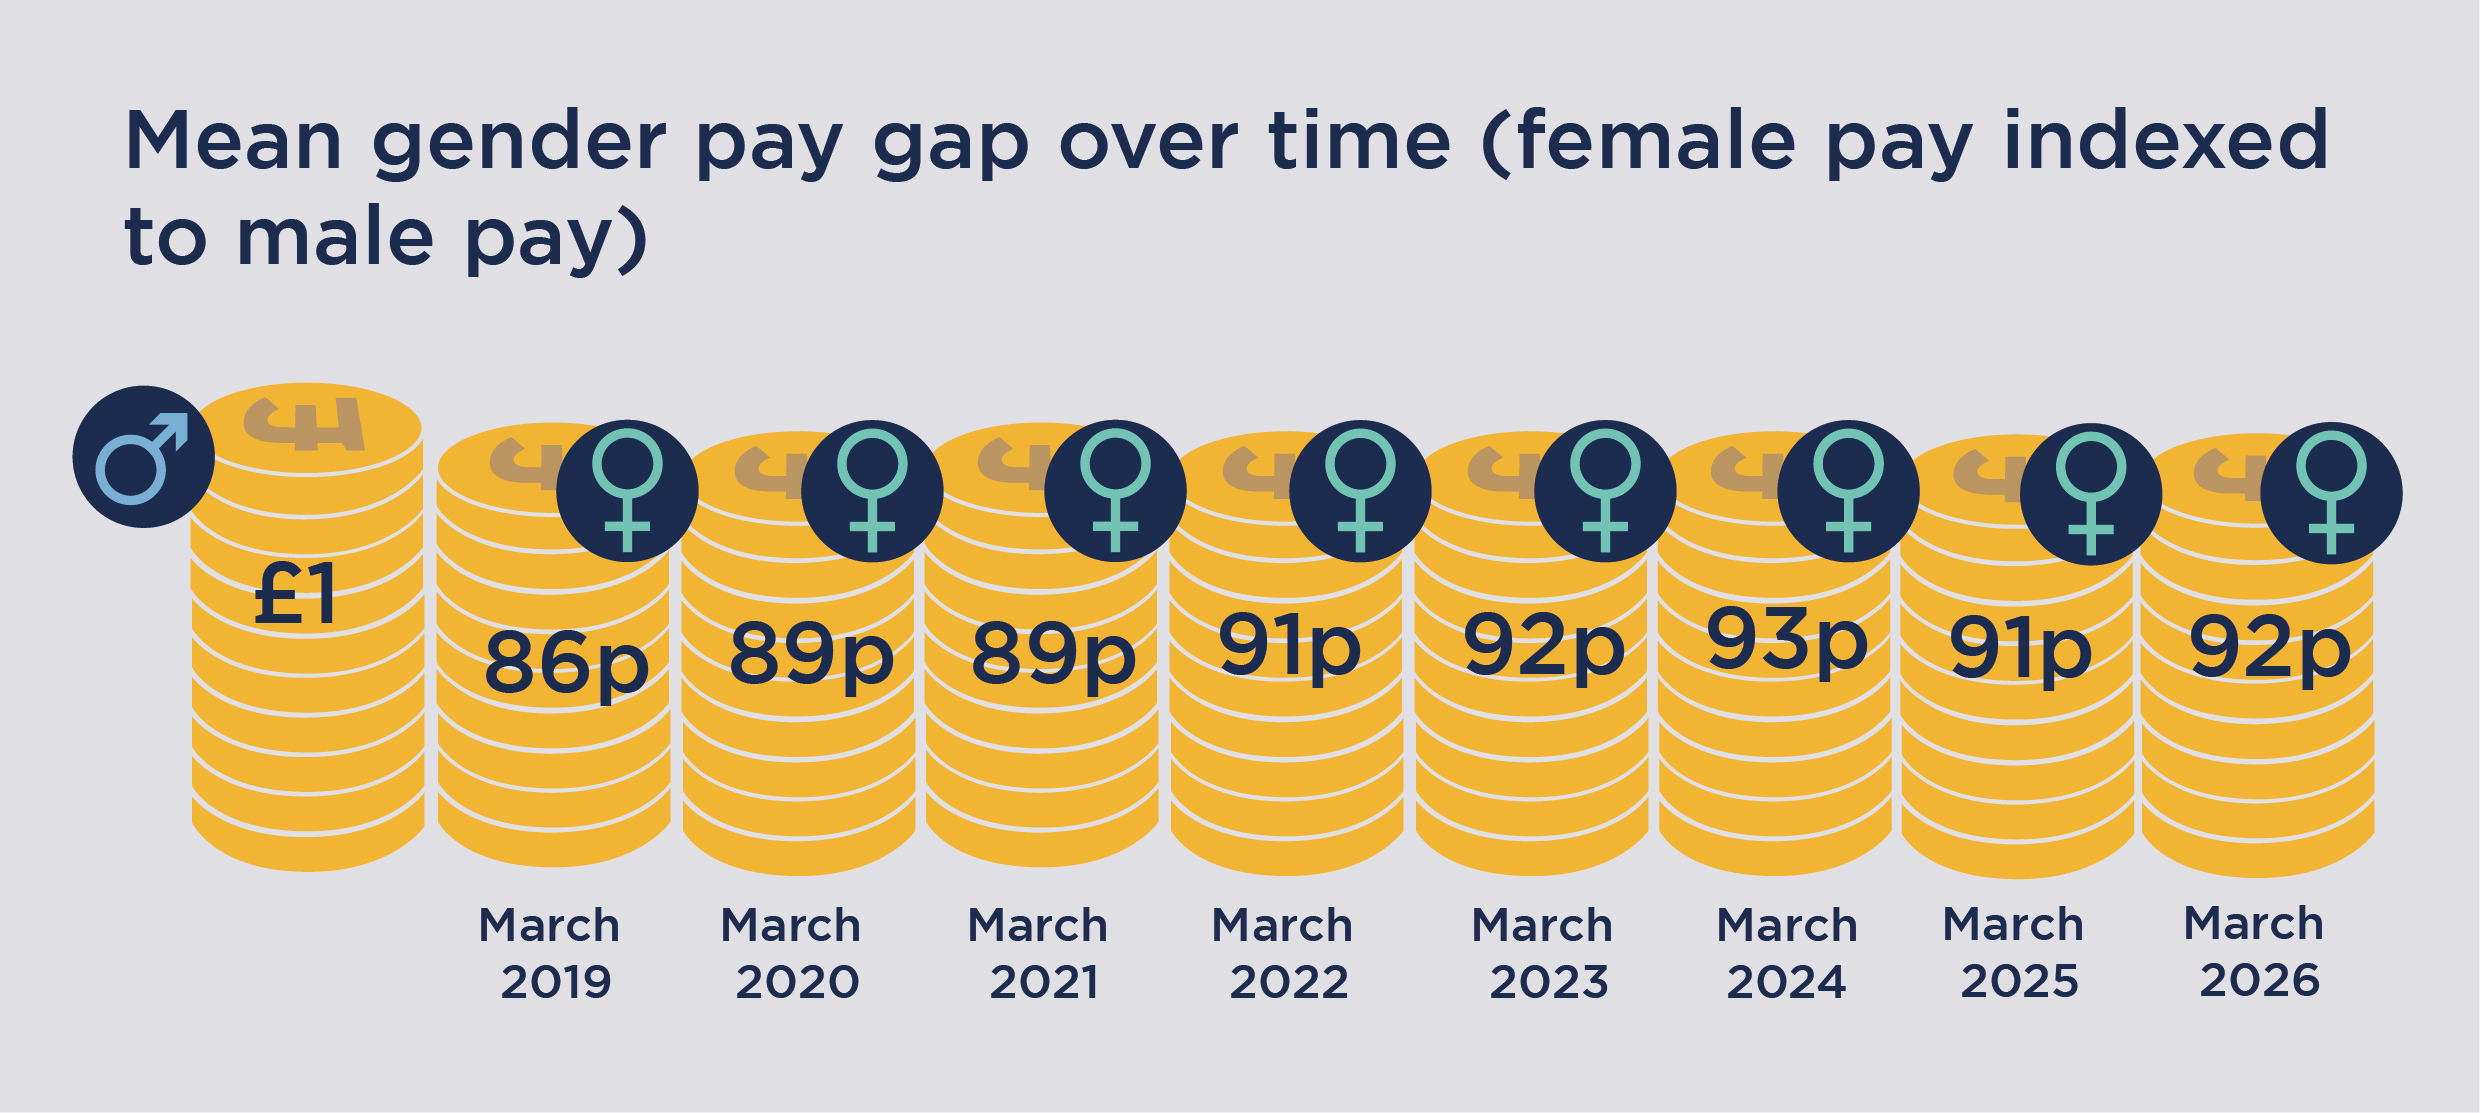
1. Our mean gender pay gap has been reducing since the OfS was incorporated.
In March 2019, the mean rate was 13.6 per cent; this has been on a downward trend. In March 2022, the rate was 8.6 per cent; in March 2026, it was 7.7 per cent.
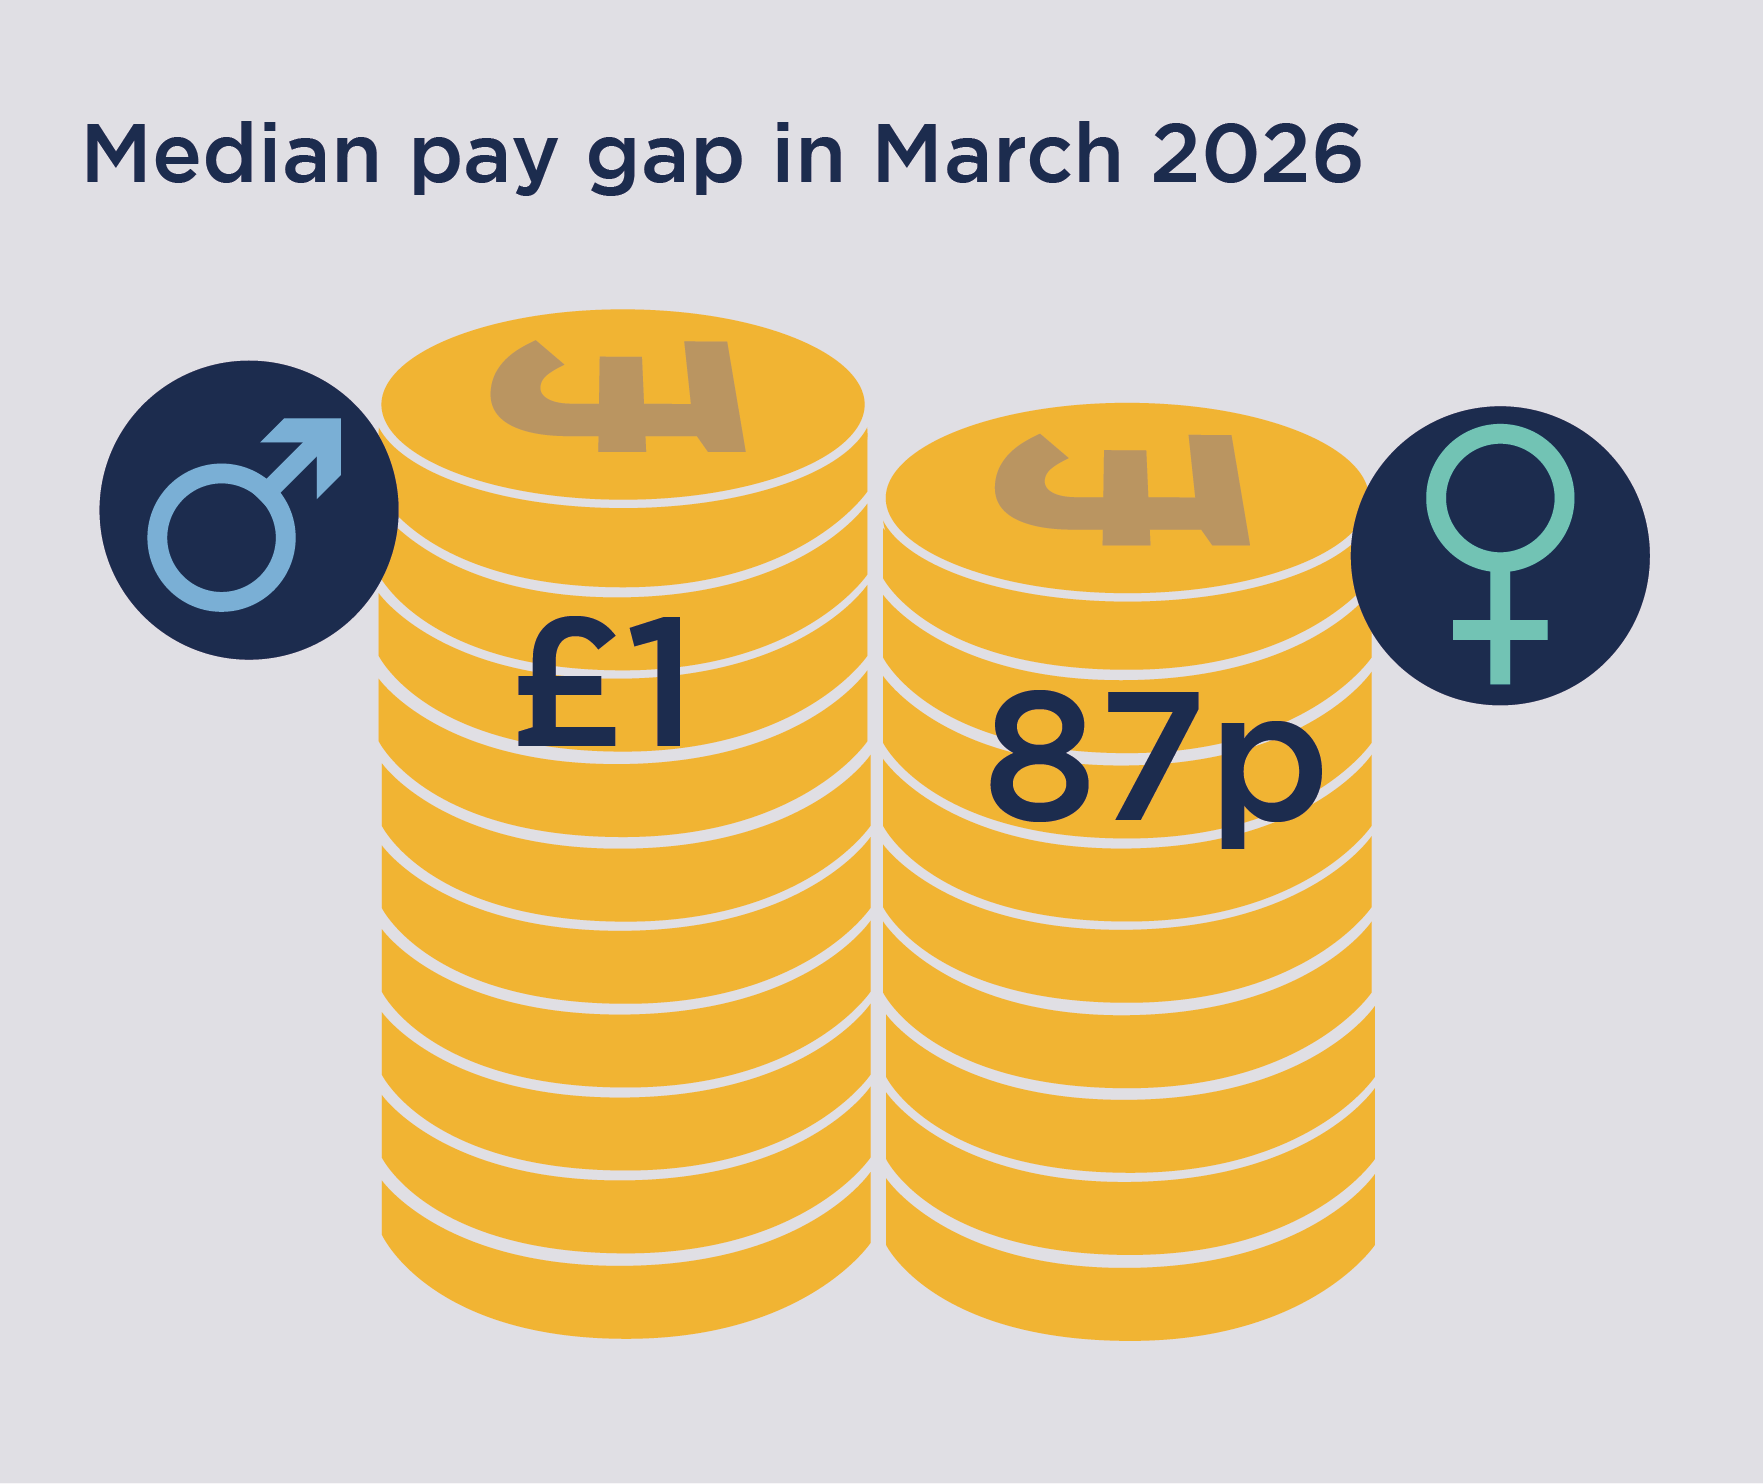
2. Our median gender pay gap in March 2026 was 12.6 per cent.
Across the whole organisation, the female mid-point salary has increased, reducing the gap to the male mid-point salary. The main reason for this is small changes in starters and leavers.
This median pay gap figure is on a par with the figure in March 2025 (12.4 per cent), much lower than the first OfS median pay gap figure in March 2019 (20.3 per cent). The drop in the median rate is due to the proportion and distribution of men and women in the organisation. Very small changes can make a significant difference in our figures.
3. The OfS has a higher proportion of men in the top two pay quartiles than women. However, the number of men and women in the highest quartile has moved steadily closer over time.
In March 2026, women were distributed fairly evenly through the four pay quartiles:
- 45.0 per cent were in the top two pay quartiles (of which 23.0 per cent were in the top quartile compared with 28.6 per cent of men)
- 55.0 per cent were in the bottom two pay quartiles.
Of the men employed in the organisation:
- 59.5 per cent were in the top two pay quartiles (of which 28.6 per cent were in the top quartile)
- 40.5 per cent were in the bottom two pay quartiles.
In March 2026, in terms of absolute numbers, the top pay quartile contained:
- 80 women
- 53 men.
From March 2019, the total number of female staff in the highest earning quartile has increased by 35. The number of men in the top quartile has increased by 17.
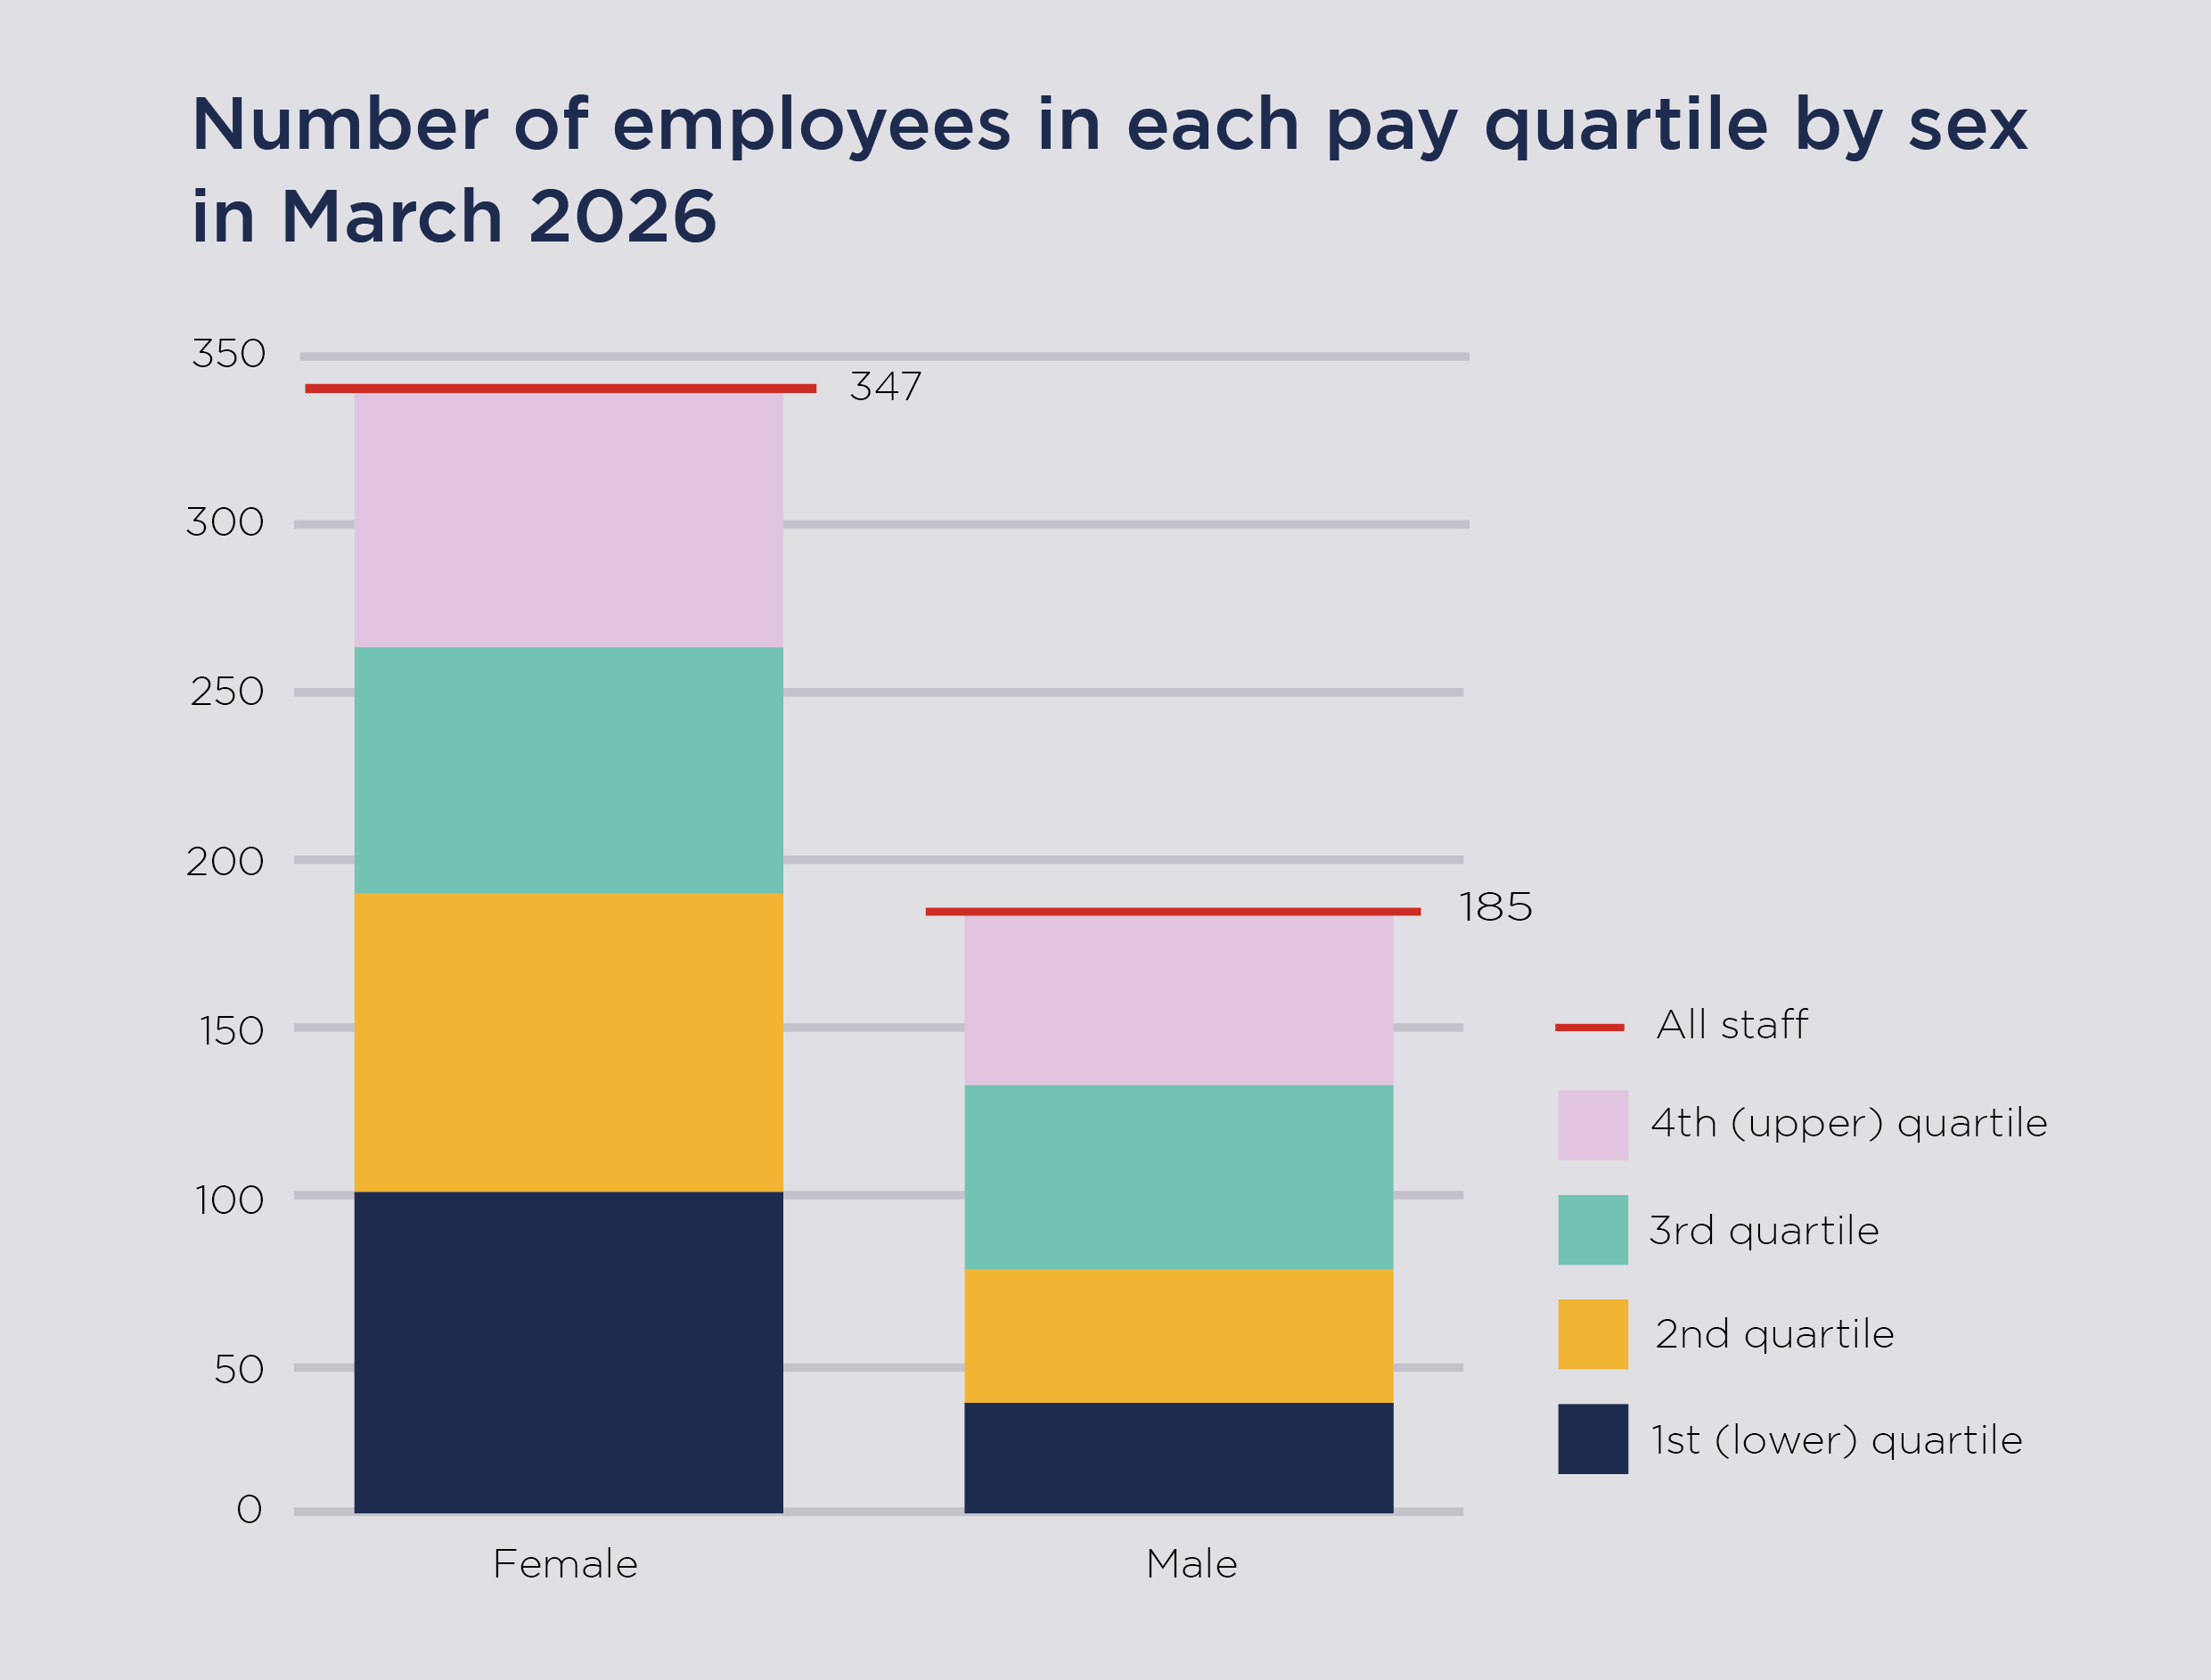
4. The OfS employs twice as many women as men. This split has remained constant since March 2019.
As we have a predominately female workforce, small movements in male employees in and out of the organisation can create a high level of volatility in our gender pay gap percentages.
Actions and way forward
Over the last seven years, the OfS has considered the impact of the pay award on the gender pay gap with a view to moving the median pay rate for women closer to the male median.
In our current people strategy (2024 to 2028), we continue to review our approach to pay and reward. We conducted an equal pay audit in 2024 and are currently reviewing our reward package for employees.
Get the data
|
|
|
March 2026 |
|
Gender pay gap – overall |
Mean |
7.66% |
|
Median |
12.64% |
|
|
Gender pay gap – bonus pay in the 12 months to 31 March 2026 |
Mean |
-8.40% |
|
Median |
0.0% |
|
|
Proportion of employees paid a bonus in the 12 months to 31 March 2025 |
Male employees |
80.54% |
|
Female employees |
76.90% |
|
Quartile |
March 2026 | |
| Female | Male | |
|
First quartile (lowest salaries) |
74.44% |
25.56% |
|
Second quartile |
69.17% |
30.83% |
|
Third quartile |
57.14% |
42.86% |
|
Fourth quartile (highest salaries) |
60.15% |
39.85% |
21 July 2026 - Updated with latest narrative, figures and charts using March 2026 data.
31 July 2025 - Updated with latest narrative, figures and charts using March 2025 data.
31 July 2024 - Updated with latest narrative, figures and charts using March 2024 data.
23 January 2024 - Updated with latest narrative, figures and charts using 2023 data.
24 March 2023 - Figures, charts and information updated with March 2022 data, and the most recent figures for September 2022.
15 March 2022 - Figures and information updated with September 2021 data, and graphics added to represent the data visually.
28 January 2022 - Figures and information updated with 2021 data.
18 March 2021 - March 2020 data added
30 March 2020 - March 2019 data published
Describe your experience of using this website