- High level overview - Key findings for risk owners
- Introduction
- Context
- VSB Planning
- Impact of VSBs on flow rate and throughput capacity
- VSB design and operational impacts
- Technical information - Detail for engineers and practitioners
- Crowd flow rates, throughput capacities and density
- Flow rates and throughput
- Crowd flow in Zone Ex
- Crowd density and level of service
- Flow and density at bollard arrays
- Conflict avoidance affects flow
- Capacity reductions at VSBs
- Bollard arrays in passages
- Configuration and perception
- Angle of approach
- VSB design features and pedestrian efficiency
- Pedestrian efficiency
- Area type and efficiencies
- Desire lines on approach to VSBs
- Bollard arrays that precede obstacles
- Bollard arrays at junctions
- Corner bollard arrays
- Affordance and VSB design
- Integrating VSBs into operations
- Operational interventions
- Flat-top features
- Seat-height features
- 'Stop and Go' systems
- Pedestrian and vehicle interaction
- References and previous studies
- References
- Previous studies
High level overview - Key findings for risk owners
Introduction
When planning for the installation of Vehicle Security Barriers (VSBs) as part of Hostile Vehicle Mitigation (HVM) measures in the vicinity of events venues, operators and designers should take a holistic approach to ensure that:
- an appropriate level of physical protection is provided;
- the impact on pedestrian movement is minimised;
- accessibility for all users is maintained;
- the measures align with operational plans and local pedestrian behaviours, as well as emergency plans;
- the measures do not introduce new hazards or any unintended consequences; and
- there is early and on-going engagement with owners and operators of neighbouring venues e.g. transport hubs, shopping centres, crowded areas owned by local authorities, fan zones etc. to ensure the design, layout and operation of the HVM provides the optimum protection.
Most event venues choose permeable bollards in areas of high spectator footfall, as they have been shown to reduce the impact on crowd flow compared to larger obstacles such as gates.
In a line of bollards (an “array”), there may be a mix of Passive VSBs (e.g. fixed bollards) and Active VSBs (e.g. retractable bollards) to enable temporary vehicle access when required.
Context
This guide builds on previous analyses and observations1, 2, 3, 4, 5, to consider the impact of VSBs on event crowds.
It is based on observations of pedestrian movement through bollard arrays positioned on primary routes at fifteen events held at eight venues in the UK between 2017 and 2022. Tens of thousands of data points were collected to assess the crowd movement and flow rates.
The guide outlines findings from the observations and planning considerations to help those designing and implementing VSB schemes in the vicinity of event venues (including Zone Ex6 and Zone 57) to minimise the impact on spectator flow.
NB. Each VSB site investigated had its own features and factors that impacted flow and density conditions, including the configuration of the array, the surrounding routing and environment, local pedestrian behaviours, the crowd management techniques deployed, etc.
Therefore, any figures used may not represent the entire range of possible conditions and capturing site-specific information would be necessary as part of the planning process.
While this guide surmises findings gathered from sports venues, it is acknowledged that the principles outlined may also be useful for owners and operators of other types of events and areas with high pedestrian footfall.
1Traffic Advisory Leaflet (TAL 01/16): The Influence of Bollards on Pedestrian Evacuation Flow, DfT and NPSA, Nov 2016 (as amended Oct 2017).
2Traffic Advisory Leaflet (TAL 2/13): Bollards and Pedestrian Movement, DfT and NPSA, May 2013 (as amended Oct 2017).
3Traffic Advisory Leaflet (TAL 01/11): Vehicle Security Barriers within the Streetscape, DfT and NPSA, Mar 2011 (as amended Oct 2017).
4Impact of Hostile Vehicle Mitigation Measures (Bollards) on Pedestrian Crowd Movement: Phase 2 Final Report for NPSA, E.R. Galea et al., Oct 2014.
5Public Realm Design Guide for Hostile Vehicle Mitigation (3rd Edition), NPSA (https://www.npsa.gov.uk/specialised-guidance/hostile-vehicle-mitigation-hvm/public-realm-design-guide-hostile-vehicle-mitigation-0).
6Guide to Safety at Sports Grounds, Sixth Edition, Sports Grounds Safety Authority (SGSA), Department for Digital, Culture, Media and Sport (DCMS) 2018.
7Defined as the buffer zone outside the sports ground perimeter, used for the public to gather before entry and for links to car parks and public transport.
VSB Planning
In addition to considering the immediate impact on flow and density for planning purposes, those designing the layout of VSBs should consider other potential impacts on pedestrians and the operation of the event venue.
Sports ground guidance6 emphasises that any proposed security overlay, including HVM measures should not “compromise any means of ingress, egress, accessibility or general circulation or result in adverse changes to the known and usual speed or direction of crowd flows”.
It is also recommended that the proposed overlay is discussed with the certifying authorities before installation.
Therefore, as part of a robust approach to overlay planning and the installation of VSB a comprehensive (quantitative and qualitative) site assessment is recommended. The site assessment will take into account different event scenarios as appropriate to each site, e.g. different days of the week, times of the day, types of event etc. to capture as complete a picture as possible about the full range of pedestrian activities in different contexts. Localised situational considerations would also be part of the assessment.
Several tools and techniques are available to support a site assessment of spectator flow:
-
Desktop studies
-
Observations of spectator flow characteristics
-
Video surveys of spectator flow characteristics
-
Suitably validated crowd simulation software
-
Trial of VSB location using temporary barriers
-
Interviewing site operators and/or operational staff
-
Observation visits to event venues with similar characteristics
Impact of VSBs on flow rate and throughput capacity
If placing VSBs within an existing environment, collect data on the normal flow rates and densities experienced in the locations where VSBs are being considered.
At lower densities (<0.4p/m2) the VSBs are not likely to have a significant impact on flow and throughput capacity.
If the crowd conditions in this environment are not known, or if flow rates from the Green Guide6 are being adopted, it is recommended that a reduction in assumed flow rate and throughput capacity is applied.
For event venues, the need to plan for an emergency condition with higher volumes and densities would require a reduction in assumed flow rate and throughput capacity to be applied.
In the following circumstances it is recommended that the assumed flow rate and throughput capacity should be reduced in the order of 10% for planning (please refer to commentary on p16-20):
- Flows at the VSB are potentially higher density in nature (≥0.4p/m2);
- VSBs are positioned in a fixed width walkway and the crowd approaches the VSB head-on (less than 20º from the perpendicular, assuming perpendicular largely unidirectional flow); and
- Bollards are 1.2m or less in height from the ground, 0.3m or less in width and arranged with air gaps of 1.2m.

6 Guide to Safety at Sports Grounds, Sixth Edition, Sports Grounds Safety Authority (SGSA), Department for Digital, Culture, Media and Sport (DCMS), 2018.
Where higher densities (≥0.4p/m2) are expected, locating a VSB so the crowd approaches head-on (±20º) is recommended. If it is bidirectional flow at densities higher than 0.4p/m2, VSBs should be treated as obstacles.
At these higher densities, where VSBs are positioned at an angle to the direction of flow, lower flow rates will result compared to those produced when positioned perpendicular to the flow.
In angles approach configuration it is recommended that the aggregate width of the bollards is treated as an obstacle when assessing the available throughput capacity.
Where the VSB infrastructure is larger than a set of permeable bollards (e.g. swing gates), this should be treated as an obstacle when assessing the available throughput capacity.

In all cases, it is good practice to test the deployment of VSBs and monitor their impact on flow and capacity when in situ. This will confirm whether the outcome is as expected or if plans need to be adapted as a result. See p6 for a list of tools that might support this.
VSB design and operational impacts
Considerations for design:
Positioning of VSBs on corners/junctions will result in lower flow rates and higher densities due to the impact of turning movements, cross movements and decision/meeting points.
It is recommended that locating VSBs on corners be avoided where possible.
If VSBs do not cover the full width of the passage, then people may choose to avoid passing through the VSB. Avoidance is more likely to occur at low densities when people have more visibility and freedom of movement. VSB use can also be influenced by existing desire lines – influencing the distribution across the VSB and reducing overall flow rates.
Considerations for operations:
There is evidence that due to increased collision avoidance behaviours, the flow rate is reduced more than VSBs alone where

- Items such as bottles or cups are placed on the top of bollards or people are sat on low-rise bollards;
- The height of bollards exceeds 1.2m;
- Staff are positioned at VSBs.
It is recommended that these factors be considered within the operational plan.
If static groups position themselves upstream of the VSB, this may have a greater impact on the flow than the VSB infrastructure itself. Proactive crowd management to keep the area clear is therefore recommended as part of the operational plan.
Where a "Stop and Go" system is in operation, the release point position is to be located to ensure that the crowd is held in a protected area (see p33) i.e. protected by VSBs.
The positioning of the control lines relative to the VSB should consider the intended aim of the system. For example, if it is the last point in the system and there is a need to fill the next area as quickly as possible, then using the VSB as a control point will reduce the potential fill rate.
Technical information - Detail for engineers and practitioners
Crowd flow rates, throughput capacities and density
Flow rates and throughput
Flow rates are used in event venues to:
- estimate how long it takes for spectators to pass through elements inside and outside the grounds(gates, doorways, stairs, etc.);
- be used as a basis for determining throughput - calculating entry capacity, exit capacity and emergency exit capacity;
- help determine the maximum capacity of the full venue (alongside risk assessment methodologies);
- plan crowd movement in the vicinity of the venue (i.e. “Zone Ex” and “Zone 5”); and
- support planning of security overlays, crowd management, transport requirements, etc.
Flow rates are typically considered as the number of persons per metre width per minute (p/m/min). The Guide to Safety at Sports Grounds (the “Green Guide”6) outlines maximum flow rates currently to be used for calculation purposes using this unit of measurement:
- On a stepped surface, 66 p/m/min
- On a level surface, 82 p/m/min

6 Guide to Safety at Sports Grounds, Sixth Edition, Sports Grounds Safety Authority (SGSA), Department for Digital, Culture, Media and Sport (DCMS),2018.
Crowd flow in Zone Ex
In the “Green Guide”6, Zone Ex is defined as “the external zone… which lies immediately beyond the outer perimeter of the sports ground, consisting of a network of routes or areas, often leading to transport hubs, and whose management is considered key to the safe and secure arrival and departure of spectators”.
While VSBs may be installed in other zones (e.g. closer to a venue boundary), most event venues seeking HVM measures will consider installing VSBs in Zone Ex, due to the pedestrian/traffic interaction in this area.
Normal flow rates in Zone Ex fall below the maximum levels used for planning, normally due to the greater amount of space outside the venue compared to inside the venue, and the crowd dispersing (e.g. on egress).
For example, recent research8 showed maximum flow rates of up to 58 p/m/min for crowds in Zone Ex:
| Examples of flow rates in Zone Ex (per event type)8 | Football | Concerts | Rugby |
| Maximum flow (p/m/min): | 53 | 56-58 | 43 |
| Average flow (p/m/min): | 28 | 31-37 | 18 |
6 Guide to Safety at Sports Grounds, Sixth Edition, Sports Grounds Safety Authority (SGSA), Department for Digital, Culture, Media and Sport (DCMS),2018.
8 The Impact of Crowd Composition on Egress Performance, Larsson et al., Fire Safety Journal, 2020 May 30:103040 (https://doi.org/10.1016/j.firesaf.2020.103040).
Crowd density and level of service
Crowd density, i.e. people per square metre (p/m2), should also be considered when assessing the impact of VSB on crowd movement.
Fruin’s “Level of Service” (LoS)9 is commonly used to relate the physical characteristics of crowd movement, specifically crowd density and crowd flow rate, to the level of comfort experienced by spectators:
![]() |
![]() |
![]() |
![]() |
![]() |
![]() |
|
| Level of service for walking (Note: there are different scales for other activities such as using stairs or queuing) |
Free circulation, with ample space for conflicting movements and opposing flow. | For one directional flows, free circulation. For reverse and crossing flows, minor conflicts. |
Some restriction in selection of walking speed and ability to pass others. High probability of conflict, and increased likelihood of restricted movement in opposing flow. |
Restricted and reduced walking speed for most spectators, due to restrictions in passing slower moving pedestrians. | The majority of spectators would have their walking speeds reduced and restricted. | All spectator movements are reduced to shuffling, with unavoidable moments of contact with other pedestrians. The spectator experience is similar to moving queues. |
| Level of service (LoS) | A | B | C | D | E | F |
| Flow rate (p/m/min): | 21-23 | 23-33 | 33-49 | 49-66 | 66-82 | Restricted, lower than LoS E |
| Density (people/m2) | <0.31 | 0.31-0.43 | 0.43-0.72 | 0.72-1.08 | 1.08-2.15 | >2.15 |
LoS A is the highest, and most free-flowing level of service, providing the most circulation freedom for spectators; and LoS F is the most restrictive of conditions, providing a less comfortable experience for spectators. LoS F is not necessarily unsafe, but it is more likely that it poses risks to safety (arising from higher crowd densities).
Flow and density at bollard arrays
Conflict avoidance affects flow
Observations and analysis show that in the vicinity of a VSB people exhibit several localised conflict avoidance behaviours, which increase in frequency as the density in the crowd increases:
- Micro lateral movements
- Micro sway of body ellipse when adjusting shoulders (e.g. hands in pockets or avoidance of additional obstacles)
- Micro delays when shuffling and adjusting direction laterally (e.g. moving into the path of following pedestrians who in turn have to adjust)
- The additional space required for these micro adjustments reduces the effective capacity of the through route.
The data collected as part of this study has indicated that the flow rate and capacity of the route is not affected by the bollard array where the crowd density is less than 0.4p/m2.
In such conditions, avoidance behaviours are possible, as each individual still has sufficient agency over their direction of movement.
If implementing a VSB on a route where existing densities are below this threshold, then a reduction in capacity need not be applied.
Capacity reductions at VSBs
Where flows at the VSB are at higher densities (≥0.4p/m2), the introduction of the bollards and associated conflict avoidance has been observed to have an impact on the throughput capacity at the point of the array.
As such, any location where these densities are envisaged as part of normal operations or emergency conditions a reduction should be applied within planning.
The research indicated that there were many factors which influence the flow and capacity, and these design and operation factors are explored in more detail elsewhere in this guidance.
Based on the range of findings the following reductions are recommended to be applied where unidirectional flows occur:
- Where VSBs are positioned in a fixed width walkway and the crowd approaches the VSB head-on (less than 20º deviation from the perpendicular), and bollards are 1.2m or less in height from the ground, 0.3m or less in width and arranged with air gaps of 1.2m the assumed flow rate and throughput capacity is recommended be reduced in the order of 10%.
- Where VSBs are positioned at an angle of >20º to the direction of flow, or the VSB infrastructure is larger than a set of permeable bollards (e.g. closed gate or modular VSB) it is recommended that the aggregate width is treated as an obstacle when assessing the available throughput capacity.
- Separately, if it is bidirectional flow at densities >0.4p/m2, VSBs should be treated as obstacles.

Bollard arrays in passages
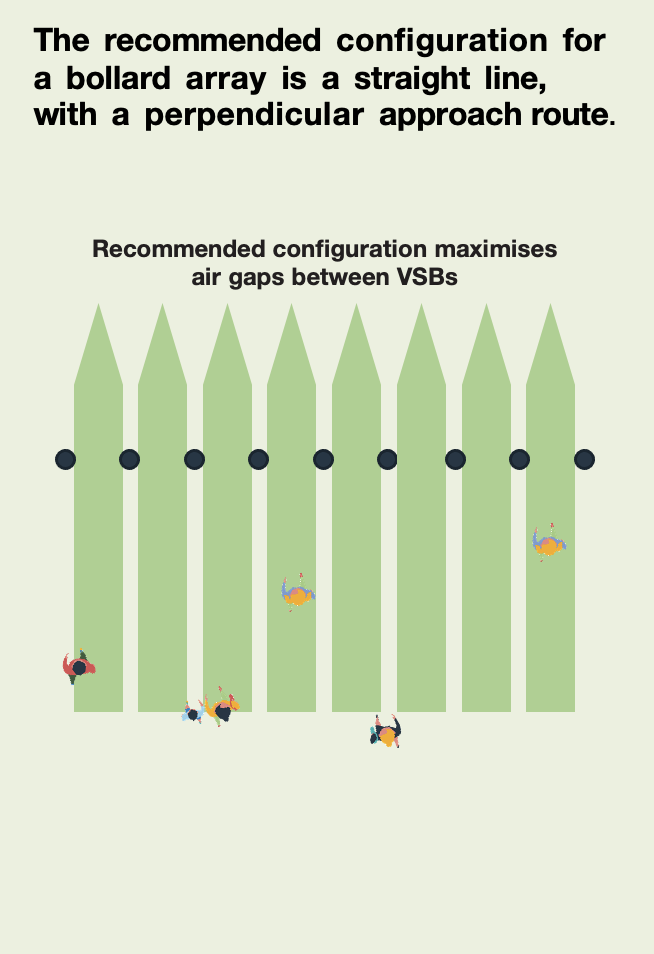
Where spectators use straight line passages (e.g. paths, roads or bridges), the movement is almost completely unidirectional, and there is the potential to position VSBs perpendicular to the direction of channel.
Placing a bollard line within a passage has been observed to reduce flow rates across the full width in the order of 10%, where the bollard dimensions are less than 1.2m in height and 0.3m in width.
While ideally the flow would be head-on to the bollard line, it is recognised that this is not an exact science. However, there is a theoretical basis to support the 10% reduction up to 20º deviation from the perpendicular10.
Testing has shown that there is some variation on the densities observed when a bollard array is positioned on the entrance or at the end of a passage2.
However, these outcomes are similar to those within a passage and it is recommended that the 10% reduction is applied in these circumstances.
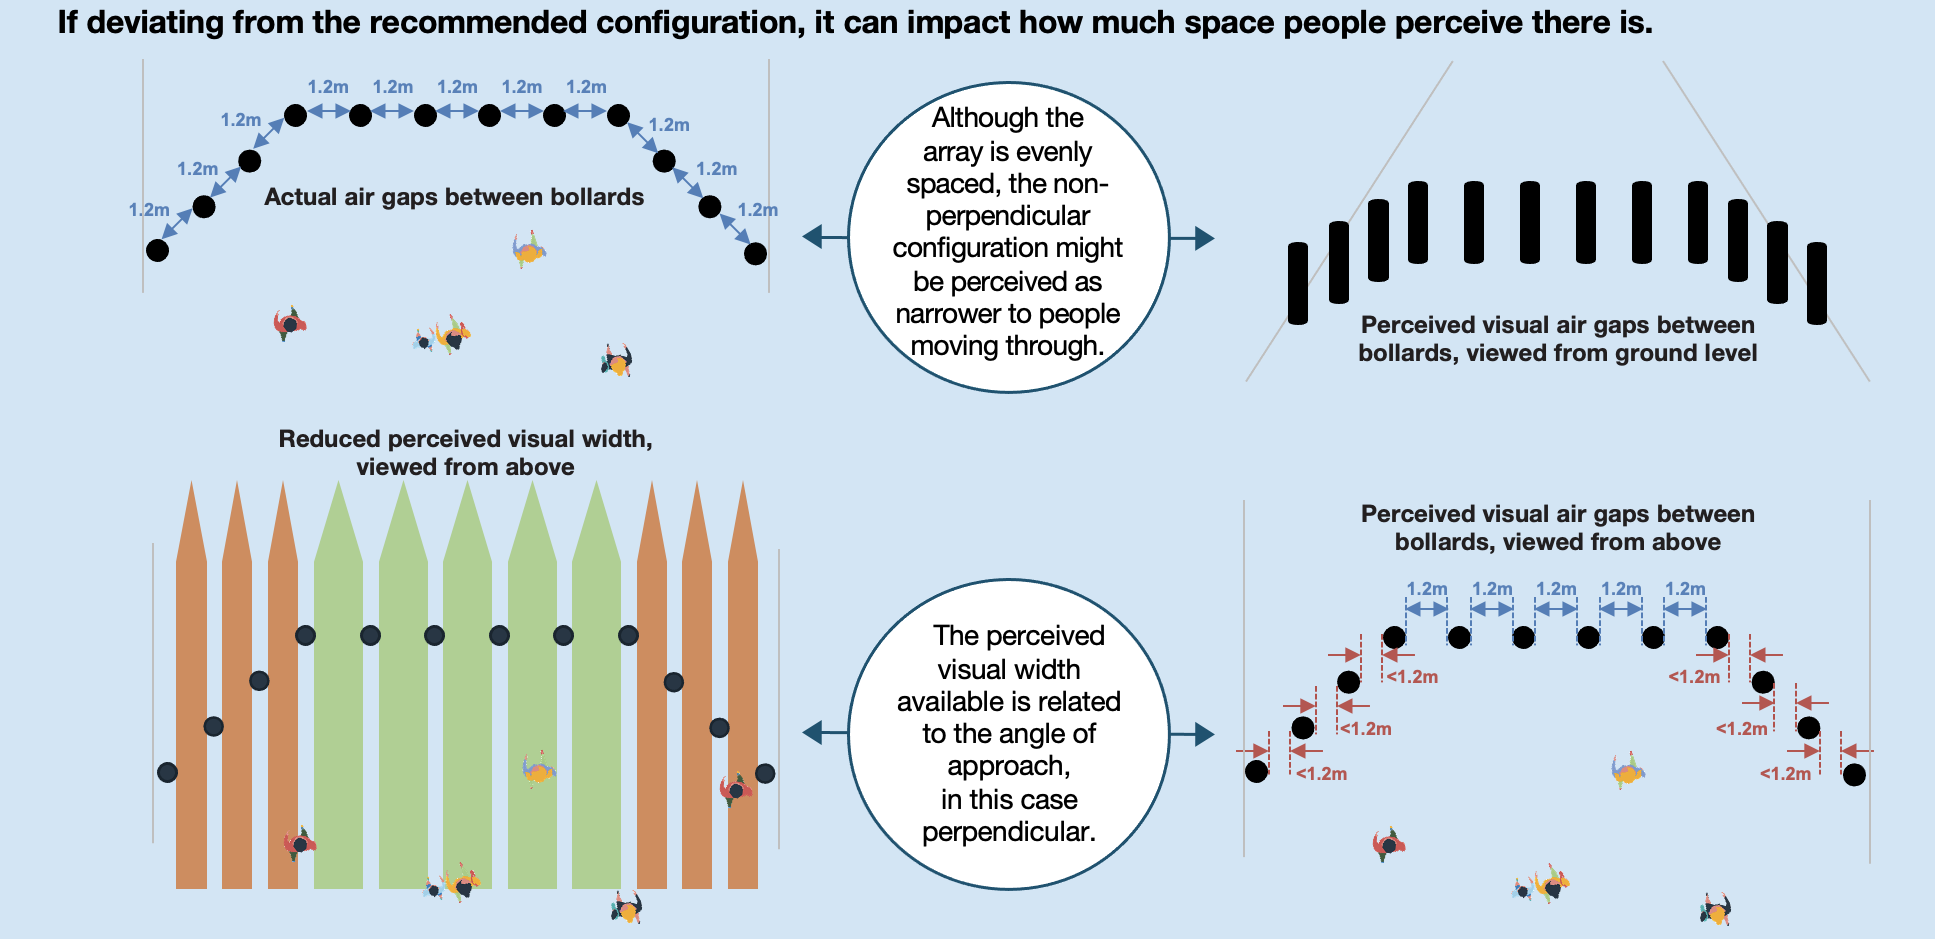
If the configuration is different to this (i.e. not in a straight line), it can impact how much space people perceive.

Configuration and perception
Angle of approach
Where arrays are configured with even spacing but not in a continuous straight line, the diagonal bollards along the line of sight appear closer together to pedestrians approaching straight on.
If the VSB alignment is not perpendicular to the angle of approach (±20º), then where higher density crowd conditions (>0.4p/m2) are expected, the recommended reduction in throughput to be adopted is to treat the bollards as obstacles.
For example, if the array were constituted of 10 bollards with a width of 50mm each, then the capacity of this route should be calculated with 500mm removed from the total width of the passage.
As demonstrated on the previous page, to avoid over- or under-utilisation within the same bollard array, a mix of approach angles on the same array or succession of arrays should be avoided.
If a mix of approach angles must be used, it is important to consider the impact this might have on usability of each area of the array.


VSB design features and pedestrian efficiency
Pedestrian efficiency
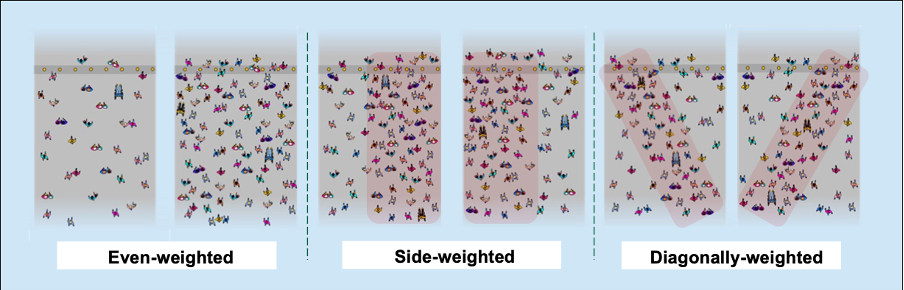
Considering the desire lines on approach to the array can be useful for design decisions (e.g. if the approach is side-weighted or diagonally-weighted to one side of the path, any non-straight part of the array could be positioned on the opposite side).
The coherent motion that forms crowd flow is made up of the aggregated motion of a large number of people (i.e. “the crowd”). Individuals in the crowd constantly interact with their environment, anticipate and react to the presence of others as well as obstacles, interruptions and congestion11.
Studies show that there is a preference to avoid collision, which involves many complex characteristics of balance, timing, human sight and perception8.
Crucially, pedestrians instinctively move at their chosen level of comfort (amount of personal space available to pedestrians and the ability to move freely) and convenience (preferred route at their desired speed) for as long as possible while avoiding conflict with others and the built environment.
The ability to do so is referred to as pedestrian efficiency.
When planning the design and installation of VSBs, the impact on pedestrian efficiency should be considered.
8 Pedestrian planning and design, Fruin, JJ., 1971.
11 Going with the flow: pedestrian efficiency in crowded scenes, Kratz and Nishino, Springer, 2012 (https://link.springer.com/content/pdf/10.1007%2F978-3-642-33765-9_40.pdf).
Area type and efficiencies
When considering the location of a VSB installation, it is useful to consider the likely use of space and goings-on within that space and classify it according to its “type” and the expected“activities” in that location.
The following Checklist questions are drawn from Transport for London’s Pedestrian Comfort Guidance12 (and adjusted for context) as a guide to the factors that may be considered during this type of assessment:
Checklist:
- What ‘area type’ is the location? Is it a high footfall area? Does it form part of the primary ingress, egress, evacuation route of the venue? Will flows be predominantly unidirectional at peak times?
- Are there significant decision points for pedestrians or substantial changes in direction or alternative routes crossing
- Are there any other obstacles in the immediate vicinity such as street furniture, pedestrian crossings, bus stops etc.?
- Are there significant movements or route choices away from the designated route or a significant imbalance in route choice? Can pre-existing knowledge on behalf of site users be assumed?
- Are there any locations with high static activity (e.g. drop-off, pick-up, meeting friends, queuing, taking photographs)?
- What are the current operational interventions by stakeholders in the area, e.g. crowd management, overlay, police activity.
12 Pedestrian Comfort Guidance for London, Transport for London, First Edition, 2010 (https://content.tfl.gov.uk/pedestrian-comfort-guidance-technical-guide.pdf).
Desire lines on approach to VSBs
Observations show that downstream destinations along with the immediate built environment create desire lines, which can impact the distribution/volume of people flow across the width of the array.
As a result, and depending on the specific topography of each site, bollard arrays are not always used evenly across their entirety.
It is important to consider these desired paths in planning the configuration of the array (see the previous pages on Configuration and perception, and Angle of approach, p19-20).
Bollard arrays that precede obstacles
The presence of obstacles in the vicinity of VSBs has the potential to reduce the flow of pedestrians moving through a bollard array.
For example, see the configuration (below). Crowds move through a passage with a widening at the end.

The bollard array is positioned and configured well: in the widening, with an angled bollard line on the right-hand side (viewed from above) to maximise the angle of approach.
However, the crowd density at the bollard array is increased compared to the approach, despite the increase in space.
This indicates that other factors impact the density and lower walking speeds in this area, such as the food kiosk and its queue, signage and people meeting/dwelling.
These create several obstacles on both sides of the array and reduce usable space.
It is important to carefully consider the placements of VSBs in areas with high levels of dwelling and queuing.
Static features i.e. VSBs, may be inaccurately identified as a greater obstacle compared to transient queues and groups meeting and dwelling.
Reconfiguring waiting spaces and food and beverage positions may reduce the impact of the barriers on spectator movement.
This may not be immediately obvious unless the location is observed during busy periods.
Bollard arrays at junctions
Significantly lower flow rates have been observed at junctions (i.e. where pedestrians select a change in route/direction).
When there is a change of direction or a merging of flows beyond the VSBs, this has been observed to affect the speed at which people approach the decision point.
It was also found that, when there is a sharp turn following the bollard array, densities can be significantly increased on the corner of the turn.
This level of crowding means there is unavoidable movements of contact with other spectators, and crowd movement can be reduced to a shuffle.

Corner bollard arrays
Given the nature of dispersal routes away from venues, there are instances where crowds reach a location where two onward routes at right angles are available. Both of these routes would require protection, and it may be that the nature of the land ownership is such that the natural positioning of VSBs would result in a right-angle configuration.
Where the aggregate width of the two onward routes is greater than that which feeds it, then the bollard arrays themselves do not inhibit free flow in their own right.
The main consideration is that these bollards are positioned in a location where there are turning movements involved, and that they are placed in a location where there is decision-making within the crowd – and both of these features result in crossing movements within the crowd as the bollard arrays are approached.
For example, consider the adjacent configuration. The impact of the bollards on flow is small given that the overall capacity of the onward routes is greater than the approach.
However, the crowd density in the vicinity of the bollard array is increased compared to the approach, particularly as spectators making a turning movement will cross paths with those continuing straight on and also attempt to ‘hug’ the corner.
It is important to carefully consider the placements of VSBs in areas that are key way finding decision points, as the complexity of movements in these areas may be exacerbated by the introduction of additional infrastructure.

Affordance and VSB design
Observations show that at low to moderate densities, i.e. where pedestrians have more freedom of choice over their movements, there appears to be an avoidance of the darker paviours, which form part of the VSB structure.
This is more pronounced when there is a strong contrast between pavement and paviour (e.g. a black paviour on a lightly coloured pathway).
Observations showed that where the contrast is lower (e.g. in wet conditions where the
paviour colour more closely matched the pathway), pedestrians did not exhibit this behaviour as frequently.
While there is no indication that such avoidance behaviours occur in higher densities, the observation emphasises the necessity for the “obstacle” to be clearly defined visually so as to avoid indirect avoidance effects.
It follows that the VSB itself should be clearly contrasting from the surrounding environment in all lighting conditions.
Integrating VSBs into operations
Operational interventions
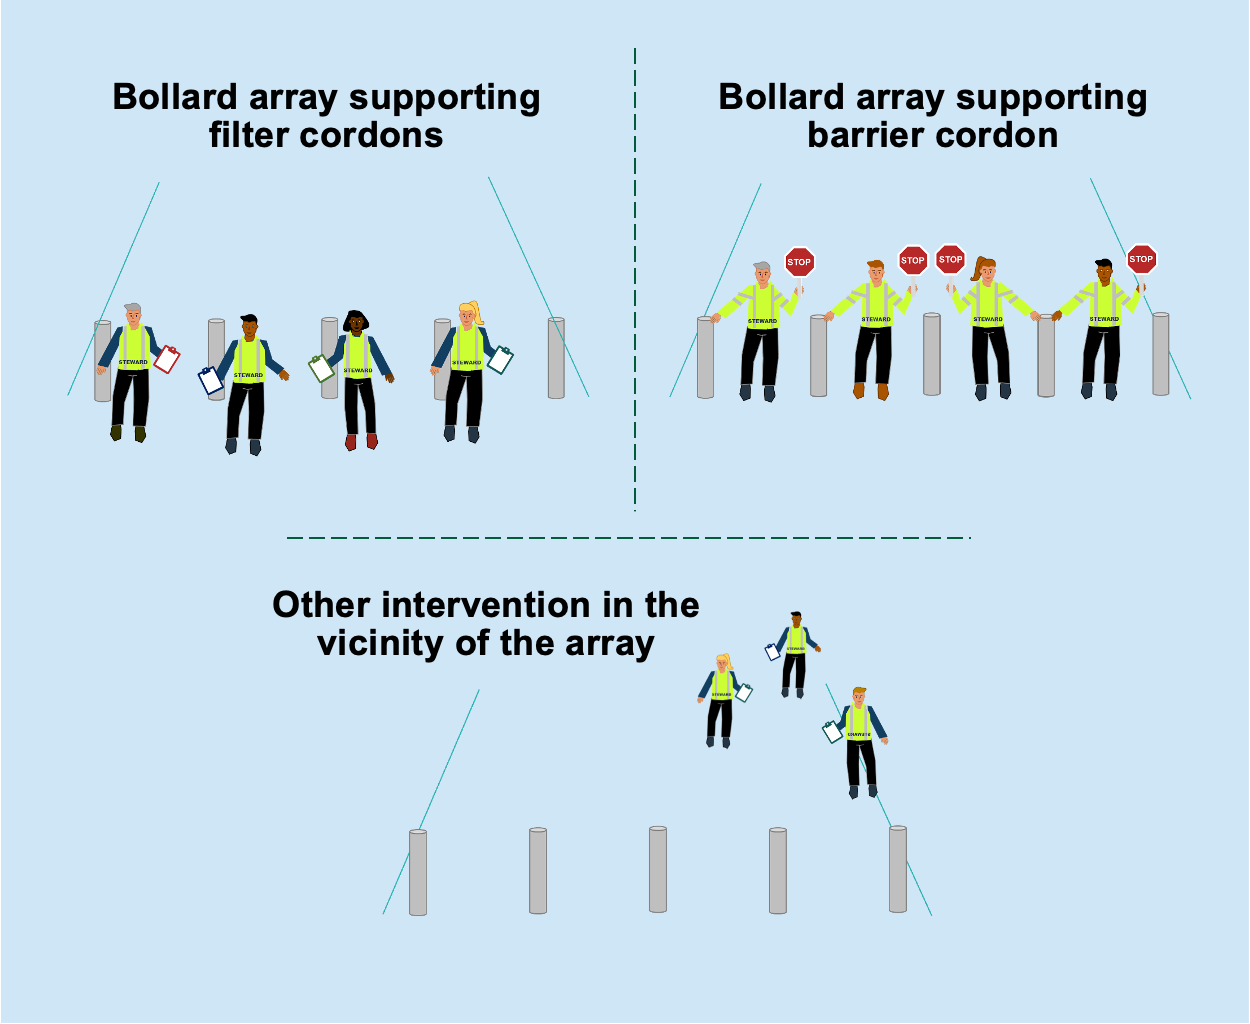
It is recommended that the relationship between existing operational interventions and VSBs is considered at the earliest (design) stage. The most common operational interventions in this context are those supporting either crowd management or security operations.
Examples are filter cordons used to slow down and filter pedestrians approaching for the purpose of monitoring them more closely; and barrier cordons used to segregate, stop or control the crowd’s movement.
Existing operational interventions may be placed in line with the VSBs where they can actively support the existing objectives and where not contributing to undue obstruction or confusion to oncoming pedestrians.
It is recommended that the placement and design of a VSB array should not result in additional operational interventions offsetting adverse impacts.
Should an operational intervention be necessary to ensure that VSBs do not adversely impact comfort, convenience or other pedestrian experiential factors, the selected design and product should be reconsidered as a poor design can seldom be offset effectively through operational management.
Flat-top features
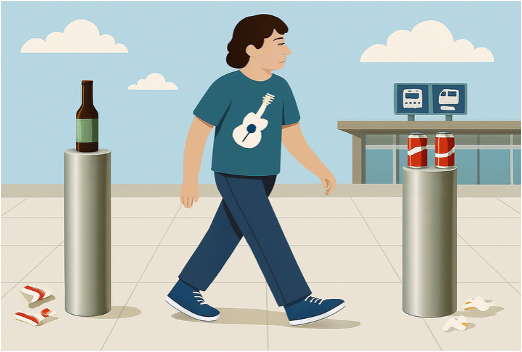
Observations have shown spectators may place objects on flat-top VSBs (e.g. rubbish such as food packaging, plastic bags and bottles).
This can impact how people move through the array (e.g. people will move to avoid the rubbish on the barrier and alter their bodies to a greater degree than if there was just a bollard).
The presence of these objects creates additional collision avoidance behaviours as people are moving/turning their upper bodies away from a perceived obstacle.
In effect, the placement of objects makes it somewhat harder to avoid collision at around elbow height.
Observations showed the objects placed on top of VSBs become dislodged over time and thus increased the risk of slips, trips and falls.
Planners should consider the design of bollards where litter might accumulate and conduct a risk assessment for hazards including slips, trips, falls, broken glass etc.
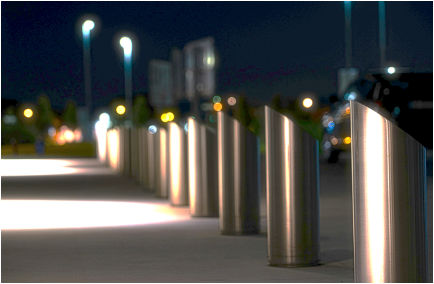
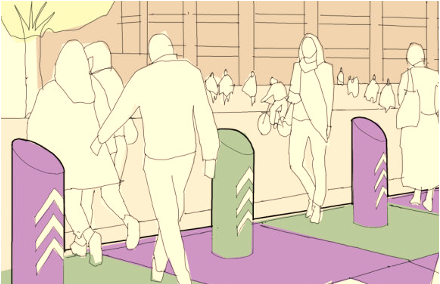
Slanted tops are often available as a design choice and are less likely to have litter placed on them because it cannot be easily deposited.
If flat-top bollards must be used, consider stewarding, messaging and/or see-through bins, to reduce littering on and around the bollards.

Seat-height features
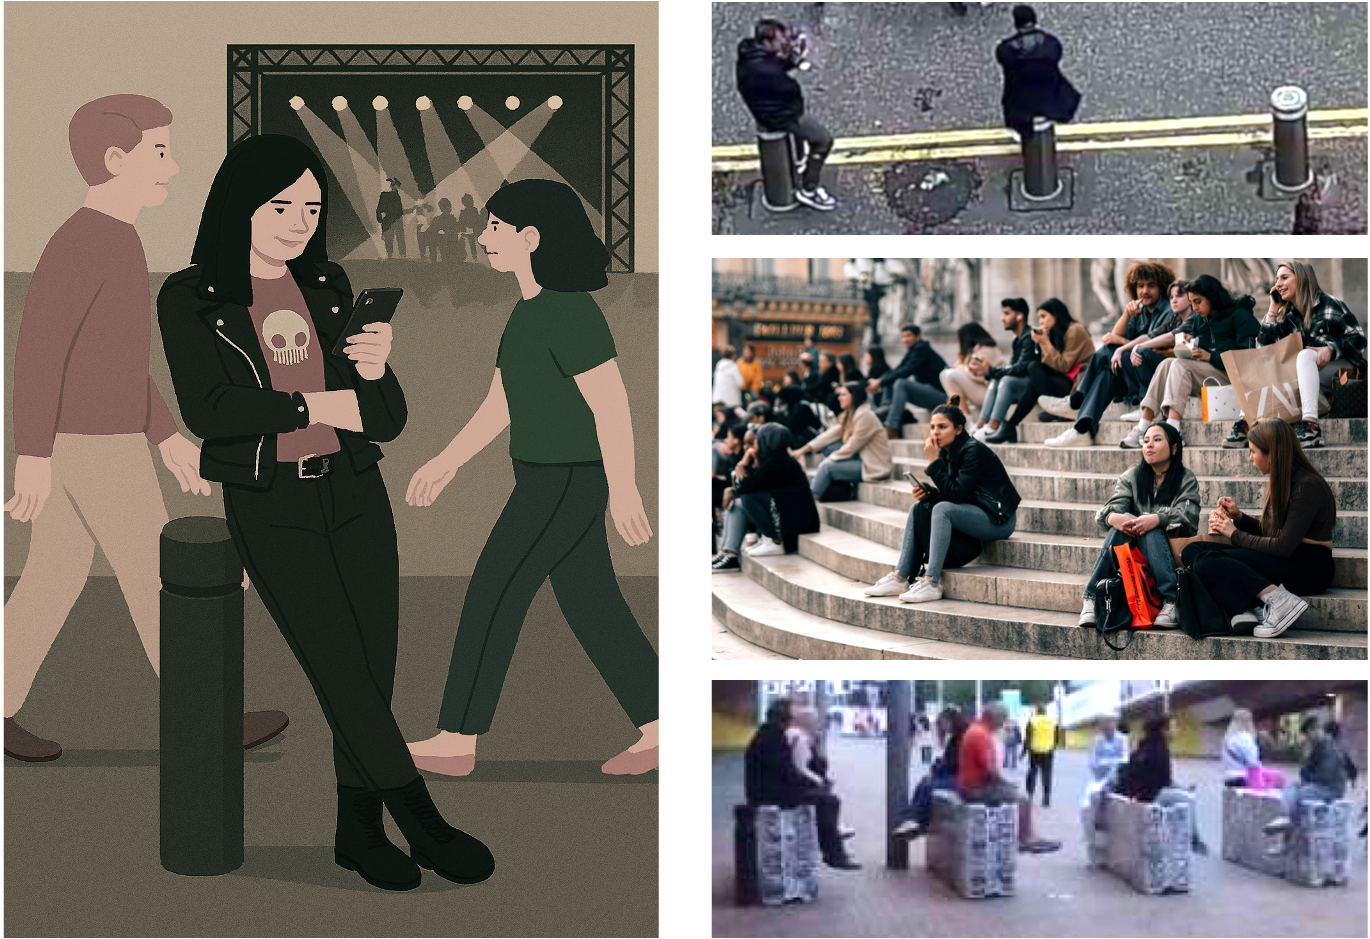
Where predominantly static activities take place (e.g. waiting to meet other people) VSBs and integrated parts of an array (e.g. trees and fencing) can increase pedestrian comfort by way of offering space to sit or lean.
Observations show that these activities were particularly prevalent in locations where bollards are up to 900mm in height.
However, at peak times (e.g. on egress) static activities like waiting or sitting can pose a significant obstacle to pedestrian flow.
Sitting and leaning activities can be deterred through good design, for example through convex or undulating shapes as well as more innovative ideas including landscaping where appropriate.
Alternative targeted operational interventions should ensure that these behaviours do not cause obstacles during peak flow, including through the use of stewards.
If predominantly static activities are likely to be an issue alternative locations should be provided (e.g. meeting points, pick-up/drop-off areas etc).


'Stop and Go' systems
“Stop and Go” or “Stop and Hold” crowd management techniques are often used in advance of a VSB array or at the array.
The data shows that where “Stop and Go” systems are put into operation in advance of the VSBs (i.e., upstream), flow rates at the bollard line can approach the maximum guidance values (i.e., approximately 80 p/m/min). This is a result of the initial surge in pedestrian movement following a release of the cordon.
These high flow rates are not sustained for significant periods of time. Soon after the initial peak, where pedestrians no longer have clear space on the approach to the bollards, the crowd movement becomes a more constant stream and flow rates settle to more typical values for Zone Ex (i.e., 50-60 p/m/min).
Where the array is also used as the management point for the “Stop and Go” cordon, this reduces the volume of the initial surge of demand, thereby ‘releasing’ those in being held less quickly.
If the intention of the system is to speedily fill the next element (e.g. loading a platform within a small train headway) then the positioning of the control line in the vicinity of the array may not support the operational objective.

In all cases, the requirement to ensure that those queuing in the “Stop and Go” system are protected from vehicles by being held behind the VSBs should be the primary consideration.
Pedestrian and vehicle interaction
VSB site consideration will identify if the barrier design would adversely influence interactions between pedestrians and vehicles operating on site, and the additional risks caused to pedestrians due to this.
These risks are especially important for temporary barrier installations, and spaces where pedestrians are known to typically interact with vehicles during ingress or egress from an event.
As an example, care should be taken to ensure the operation of barriers that are manually opened and closed to allow vehicles on/off a site do not result in the unnecessary build up of pedestrian queues.
This may mean pedestrians choose to walk in areas beyond the protection given by the HVM, to avoid the queue, thus putting them at a higher risk from vehicles.

References and previous studies
References
1 Traffic Advisory Leaflet (TAL 01/16): The Influence of Bollards on Pedestrian Evacuation Flow, DfT and NPSA, Nov 2016 (as amended Oct 2017).
2 Traffic Advisory Leaflet (TAL 2/13): Bollards and Pedestrian Movement, DfT and NPSA, May 2013 (as amended Oct 2017).
3 Traffic Advisory Leaflet (TAL 01/11): Vehicle Security Barriers within the Streetscape, DfT and NPSA, Mar 2011 (as amended Oct 2017).
4 Impact of Hostile Vehicle Mitigation Measures (Bollards) on Pedestrian Crowd Movement: Phase 2 Final Report for NPSA, E.R. Galea et al., Oct 2014.
5 Public Realm Design Guide for Hostile Vehicle Mitigation (3rd Edition), NPSA, version 3.1 (Revised November 2023) (https://www.npsa.gov.uk/specialised-guidance/hostile-vehicle-mitigation-hvm/public-realm-design-guide-hostile-vehicle-mitigation-0).
6 Guide to Safety at Sports Grounds, Sixth Edition, Sports Grounds Safety Authority (SGSA), Department for Digital, Culture, Media and Sport (DCMS), 2018
7 Defined as the buffer zone outside the sports ground perimeter, used for the public to gather before entry and for links to car parks and public transport.
8 The Impact of Crowd Composition on Egress Performance, Larsson et al., Fire Safety Journal, 2020 May 30:103040 (https://doi.org/10.1016/j.firesaf.2020.103040).
9 Pedestrian planning and design, Fruin, JJ., 1971.
10 Metric Handbook, 4th Edition, edited by David Littlefield, Routledge, London, UK, 2012 (https://doi.org/10.4324/9780080963419).
11 Going with the flow: pedestrian efficiency in crowded scenes, Kratz and Nishino, Springer, 2012 (https://link.springer.com/content/pdf/10.1007%2F978-3-642-33765-9_40.pdf).
12 Pedestrian Comfort Guidance for London, Transport for London, First Edition, 2010 (https://content.tfl.gov.uk/pedestrian-comfort-guidance-technical-guide.pdf).
Previous studies
Previous work examined the impact of VSBs (specifically, permeable bollards) focussed on transport environments and exit movement1. Pedestrian flow rates were captured (i.e., the number of people who could pass through the bollards over time).
It was found that when dispersing from building exits, pedestrian flow was not significantly impacted by bollard arrays that were positioned at least 3m away from the exit, when there were gaps of 1.2m between the bollards.
Bollards placed closer to an exit (e.g., 2m away) may reduce the flow of people by up to 9%. Bollards placed within a corridor may reduce the flow of people by 8%, but this has not been systematically tested with realistic densities for large crowd flow.
Field observations at nine sites (including a sports stadium) found that these types of bollard arrays had only subtle impacts on individual pedestrian behaviour2. It was found that bollard lines running perpendicular to pedestrian movement had a lesser impact than those running parallel to movement and provided better use of space.

1Traffic Advisory Leaflet (TAL 01/16): The Influence of Bollards on Pedestrian Evacuation Flow, DfT and NPSA, Nov 2016 (as amended Oct 2017).
2Traffic Advisory Leaflet (TAL 2/13): Bollards and Pedestrian Movement, DfT and NPSA, May 2013 (as amended Oct 2017).


